
The solar constant is a flux density measuring mean solar electromagnetic radiation (solar irradiance) per unit area. It is measured on a surface perpendicular to the rays, one astronomical unit (AU) from the Sun (roughly the distance from the Sun to the Earth).
The solar constant includes all types of solar radiation, not just the visible light. It is measured by satellite as being 1.361 kilowatts per square meter (kW/m²) at solar minimum and approximately 0.1% greater (roughly 1.362 kW/m²) at solar maximum.
The solar “constant” is not a physical constant in the modern CODATA scientific sense; that is, it is not like the Planck constant or the speed of light which are absolutely constant in physics. The solar constant is an average of a varying value. In the past 400 years it has varied less than 0.2 percent.
Formula
To calculate the solar constant, it is enough to divide the energy flow that the Sun emits by the ratio of areas between the surface of the Sun

The solar constant can be expressed in
A unit very used to measure the energy that reaches the top of the atmosphere in a day is:
Thus a place at 30º N latitude receives June 21 , summer solstice day an insolation of 1004,7 langleys / day and on December 21 , winter solstice day only 480,4 langleys / day.
On the other hand, annual insolation in the upper part of the atmosphere at different latitudes can be calculated. For the pole the annual insolation is 133.2 kilolangleys / year while at the equator it rises to 320.9 kilolangleys / year where the klangley = 1000 langleys.
Calculation
Solar irradiance is measured by satellite above Earth’s atmosphere, and is then adjusted using the inverse square law to infer the magnitude of solar irradiance at one Astronomical Unit (AU) to evaluate the solar constant. The approximate average value cited, 1.3608 ± 0.0005 kW/m², which is 81.65 kJ/m² per minute, is equivalent to approximately 1.951 calories per minute per square centimeter, or 1.951 langleys per minute.
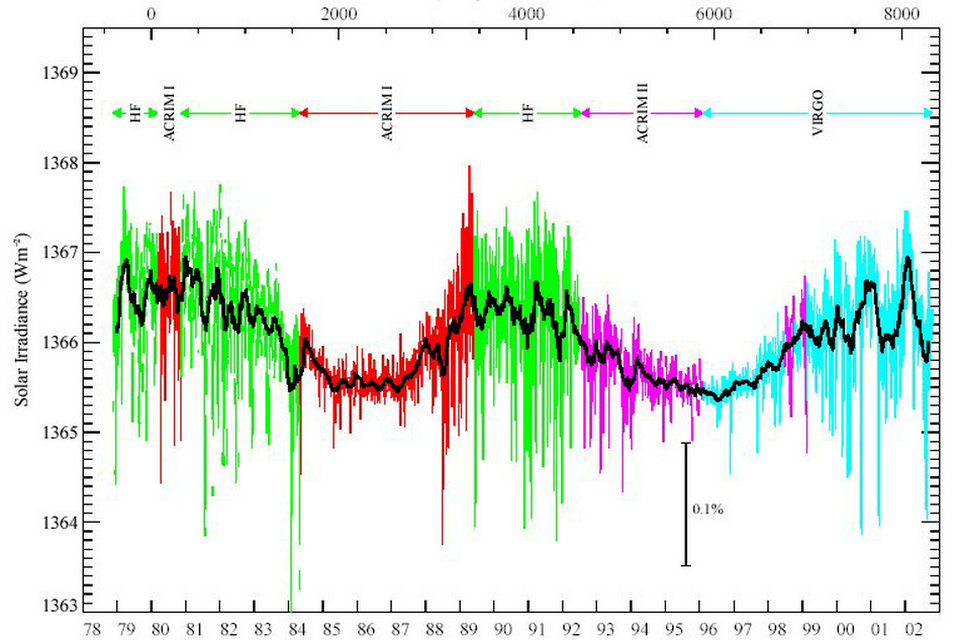
Solar output is nearly, but not quite, constant. Variations in total solar irradiance (TSI) were small and difficult to detect accurately with technology available before the satellite era (±2% in 1954). Total solar output is now measured as varying (over the last three 11-year sunspot cycles) by approximately 0.1%; see solar variation for details.
Solar luminosity
energy is called the energy emitted by the Sun in the unit of time. Therefore it is worth:
Analogous result is obtained instead of doing the calculation for the solar surface, doing it at a distance from the Earth and using the solar constant . The flow emitted by the Sun decreases with distance because it is distributed over a larger surface. The spherical surface at the distance the Earth is in is worth:
The solar luminosity is therefore worth:
Analogous result is obtained by making the calculation by the following reasoning:
The angular diameter of the Earth seen from the Sun is approximately 1 / 11,700 radian , so the solid angle of the Earth from the Sun is 1 / 175,000,000 steradians . This implies that the Earth intercepts only a part of the 2000 million radiation that the Sun emits (approximately 3.6 × 10 26 W).
The solar constant includes all types of radiation, not just the visible one . The solar constant is related to the apparent magnitude of the Sun (the intensity of its brightness as received by the viewer) whose value is -26.8; since both parameters come to describe the observable brightness of the Sun, although the magnitude refers only to the visible spectrum .
Historical measurements
In 1838, Claude Pouillet made the first estimate of the solar constant. Using a very simple pyrheliometer he developed, he obtained a value of 1.228 kW/m², close to the current estimate.
In 1875, Jules Violle resumed the work of Pouillet and offered a somewhat larger estimate of 1.7 kW/m² based, in part, on a measurement that he made from Mont Blanc in France.
In 1884, Samuel Pierpont Langley attempted to estimate the solar constant from Mount Whitney in California. By taking readings at different times of day, he tried to correct for effects due to atmospheric absorption. However, the final value he proposed, 2.903 kW/m², was much too large.
Between 1902 and 1957, measurements by Charles Greeley Abbot and others at various high-altitude sites found values between 1.322 and 1.465 kW/m². Abbot showed that one of Langley’s corrections was erroneously applied. Abbot’s results varied between 1.89 and 2.22 calories (1.318 to 1.548 kW/m²), a variation that appeared to be due to the Sun and not the Earth’s atmosphere.
In 1954 the solar constant was evaluated as 2.00 cal/min/sq cm ± 2%. Current results are about 2.5 percent lower.
Relationship to other measurements
Solar irradiance
The actual direct solar irradiance at the top of the atmosphere fluctuates by about 6.9% during a year (from 1.412 kW/m² in early January to 1.321 kW/m² in early July) due to the Earth’s varying distance from the Sun, and typically by much less than 0.1% from day to day. Thus, for the whole Earth (which has a cross section of 127,400,000 km²), the power is 1.730×10¹⁷ W (or 173,000 terawatts), plus or minus 3.5% (half the approximately 6.9% annual range). The solar constant does not remain constant over long periods of time (see Solar variation), but over a year the solar constant varies much less than the solar irradiance measured at the top of the atmosphere. This is because the solar constant is evaluated at a fixed distance of 1 Astronomical Unit (AU) while the solar irradiance will be affected by the eccentricity of the Earth’s orbit. Its distance to the Sun varies annually between 147.1•106 km at aphelion and 152.1•106 km at perihelion.
The Earth receives a total amount of radiation determined by its cross section (π•RE²), but as it rotates this energy is distributed across the entire surface area (4•π•RE²). Hence the average incoming solar radiation, taking into account the angle at which the rays strike and that at any one moment half the planet does not receive any solar radiation, is one-fourth the solar constant (approximately 340 W/m²). The amount reaching the Earth’s surface (as insolation) is further reduced by atmospheric attenutation, which varies. At any given moment, the amount of solar radiation received at a location on the Earth’s surface depends on the state of the atmosphere, the location’s latitude, and the time of day.
Apparent magnitude
The solar constant includes all wavelengths of solar electromagnetic radiation, not just the visible light (see Electromagnetic spectrum). It is positively correlated with the apparent magnitude of the Sun which is −26.8. The solar constant and the magnitude of the Sun are two methods of describing the apparent brightness of the Sun, though the magnitude is based on the Sun’s visual output only.
The Sun’s total radiation
The angular diameter of the Earth as seen from the Sun is approximately 1/11,700 radians (about 18 arc-seconds), meaning the solid angle of the Earth as seen from the Sun is approximately 1/175,000,000 of a steradian. Thus the Sun emits about 2.2 billion times the amount of radiation that is caught by Earth, in other words about 3.86×1026 watts.
Past variations in solar irradiance
Space-based observations of solar irradiance started in 1978. These measurements show that the solar constant is not constant. It varies with the 11-year sunspot solar cycle. When going further back in time, one has to rely on irradiance reconstructions, using sunspots for the past 400 years or cosmogenic radionuclides for going back 10,000 years. Such reconstructions show that solar irradiance varies with distinct periodicities. These cycles are: 11 years (Schwabe), 88 years (Gleisberg cycle), 208 years (DeVries cycle) and 1,000 years (Eddy cycle).
Over billions of years, the Sun is gradually expanding, and emitting more energy from the resultant larger surface area. The unsolved question of how to account for the clear geological evidence of liquid water on the Earth billions of years ago, at a time when the sun’s luminosity was only 70% of its current value, is known as the faint young Sun paradox.
Variations due to atmospheric conditions
At most about 75% of the solar energy actually reaches the earth’s surface, as even with a cloudless sky it is partially reflected and absorbed by the atmosphere. Even light cirrus clouds reduce this to 50%, stronger cirrus clouds to 40%. Thus the solar energy arriving at the surface can vary from 550 W/m² with cirrus clouds to 1025 W/m² with a clear sky.
Variation
The radiation emitted by the Sun is not exactly constant, but suffers from chaotic fluctuations of very small amplitude and periodic oscillations described as cycles of activity , as well as trend variations by which the Sun’s brightness has slowly grown over time of its history.
The periodic variations seem to consist of several oscillations of different period (duration), of which the best known is that of 11 years that manifests as a cycle of variation of the abundance of sunspots in the photosphere . Recent cycles show a variation of solar brightness within the limits of 0.1%; However, from Maunder’s minimum , a time without spots between 1650 and 1700, solar radiation could have grown by up to 0.6%.
Theoretical models of the development of the Sun imply that about 3,000 million years ago, when the Solar System was only one third of its age, the Sun emitted only 75% of the energy it currently emits. The Earth’s climate was less cold than this data implies, because the composition of the atmosphere was very different, much more abundant in greenhouse gases, especially carbon dioxide (CO 2 ) and ammonia (NH 3 ).
Other variations of a cyclic nature have to do with the orbital parameters of the Earth, especially with the eccentricity . This does not affect the average energy received in the long term, but it does affect the seasonal variations. Currently, the Earth is in its perihelion at the beginning of January, almost coinciding with the winter solstice, which contributes to the Northern Hemisphere collecting more solar energy than the South. But the date of perihelion (and of the aphelion) oscillates with a very long period.
In any case, the eccentricity of the Earth’s orbit is relatively small, but it is large, however, in other planets, such as Mars and above all Pluto (now considered ” dwarf planet “). In these, the difference in energy intercepted at different times of the year can be considerable. The following table presents the solar constants of the planets of the Solar System, calculated according to their average distance.
Relevance
The value of the solar constant, as well as its relative stability, are fundamental for many of the most important terrestrial processes. In particular, for the determination of climate , external geological processes, and for life. Also for the future of humanity, at least as it depends on the technological development of renewable energy .
Solar constant for the different planets
The flow emitted by the Sun decreases with distance because it is distributed over a larger surface. Suppose we call{
that is to say:
Suppose for example the planet Mars that is 1.5236 AU away from the solar constant will be worth:
Effective temperature on different planets
To calculate the effective temperature in the different planets, the calculation of the terrestrial radiative balance must be made but generalized for the planets. It is assumed that each planet has reached equilibrium by intercepting from the Sun the same energy that radiates from its temperature.
The reason for 4 is that only the section of the planet intersects solar energy while the entire surface of the planet radiates it.
As the energy absorbed and radiated are equal by thermal equilibrium, it results:
The evaluation of the formula gives the different effective temperatures of the planets. These temperatures should not be confused with surface temperatures, as the atmosphere and clouds reflect part of the short-wave solar radiation while the long waves emitted by the planet’s thermal radiation are absorbed in part by greenhouse gases, significantly increasing the surface temperature especially in the case of Venus while if the atmosphere is thin as in the case of Mars there should not be much difference.
| Planet | K (W / m²) | K / K 0 | Albedo | T e (K) |
|---|---|---|---|---|
| Mercury | 9040 | 6.7 | 0.058 | 442 |
| Venus | 2610 | 1.9 | 0.71 | 244 |
| Earth | 1360 | 1 | 0.33 | 253 |
| Mars | 590 | 0.4 | 0.17 | 216 |
| Jupiter | fifty | 0.04 | 0,52 | 87 |
| Saturn | fifteen | 0.01 | 0.47 | 63 |
| Uranus | 3.7 | 0.003 | 0,51 | 33 |
| Neptune | 1,5 | 0.001 | 0.41 | 32 |
Source from Wikipedia