Visualization of technical information

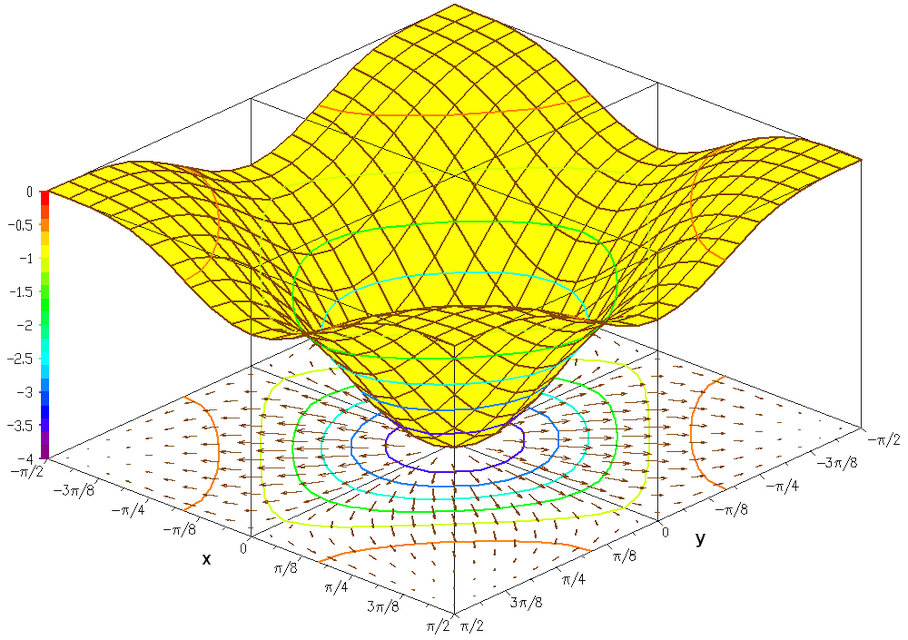
Graph of a function
In science, engineering, technology, finance, and other areas, graphs are tools used for many purposes. In the simplest case one…
Infographic
Infographics or Information graphics are graphic visual representations of information, data or knowledge intended to present information quickly and clearly.…
Plan Drawing
Plans are a set of drawings or two-dimensional diagrams used to describe a place or object, or to communicate building…
Engineering Drawing
An engineering drawing, a type of technical drawing, is used to fully and clearly define requirements for engineered items. A…
Architectural Drawing
An architectural drawing or architect's drawing is a technical drawing of a building (or building project) that falls within the…
Technical Drawing
Technical drawing, drafting or drawing, is the act and discipline of composing drawings that visually communicate how something functions or…
Illustration
An illustration is a decoration, interpretation or visual explanation of a text, concept or process, designed for integration in published…