The Philippines energy sector is a net importer (46% of needs in 2014) despite the low level of energy consumption compared to that of its Southeast Asian neighbors.
The total primary energy consumption of the Philippines in 2012 was 30.2 Mtoe (million Tonnes of oil equivalent), most of which came from fossil fuels. Electricity consumption in 2010 was 64.52 TWh, of which almost two-thirds came from fossil fuels, 21% from hydroelectric plants, and 13% from other renewable sources. The total generating capacity was 16.36 GW.
The population of the Philippines is over 101 million people, and as a rapidly developing nation, has seen a rapid increase in GDP, averaging 6.1% from 2011 to 2015. Energy-intensive manufacturing and retail industries are the driving factors of the Philippines’ economic growth. Given its large population and rapidly growing economy, the country’s energy needs are significant and growing rapidly. According to the Philippines Department of Energy, the Philippines consumed 75,266 gigawatt-hours (GWh) of electricity in 2013. Of this, 27.39% went to powering residential areas, 24.31% to commercial establishments and 27.46% to the industrial sector. With 72.84% of electrical energy being consumed by Luzon, 14.75% by Visayas, and 12.41% by Mindanao in 2013.
Primary energy production in the Philippines includes fairly modest volumes of oil, natural gas and coal. Renewable energies are a significant part of electricity production with geothermal energy, hydroelectricity and biomass.
The per capita primary energy consumption in the Philippines in 2014 was one-quarter of the world average and one-third that of Asia; it was divided into 62% fossil fuels (especially oil: 31% and coal: 24%) and 38% renewable energies (especially geothermal: 18.5% and biomass: 18%).
Filipino electricity generation in 2014 was 74.4% fossil fuels (coal: 42.8%, oil: 7.4%, gas: 24.2%) and 25.6% energy. renewable energy (hydroelectricity: 11.8%, geothermal energy: 13.3%, miscellaneous: 0.5%). The Philippines in 2015 the 2 th World geothermal electricity producer with 14.8% of the world total, behind the United States.
CO2 emissionsenergy-related in the Philippines in 2014 was 0.97 tonnes CO 2 per capita, 21.7% of the world average and 61% of that of Asia.
Overview
| Energy in the Philippines | ||||||
|---|---|---|---|---|---|---|
| Population | Primary energy consumption | Production | Net import | Electricity consumption | Emissions of CO 2 |
|
| Year | Million | Mtoe | Mtoe | Mtoe | TWh | Mt CO 2eq |
| 1990 | 61.95 | 28.71 | 17.22 | 12.33 | 22.35 | 38,04 |
| 2000 | 77.93 | 39.99 | 19.55 | 21,03 | 38.95 | 68.11 |
| 2008 | 90.30 | 40.11 | 22.97 | 18.11 | 53.14 | 71,16 |
| 2009 | 91,64 | 38.19 | 23.47 | 15.62 | 54.42 | 71.45 |
| 2010 | 93.04 | 40.40 | 23.55 | 18.31 | 59.94 | 77,11 |
| 2011 | 94.50 | 40.67 | 24,02 | 18.12 | 61.50 | 77.74 |
| 2012 | 96.02 | 43.25 | 25.17 | 19.69 | 64.56 | 80.39 |
| 2013 | 97.57 | 44.79 | 24.49 | 20.93 | 67.53 | 89.63 |
| 2014 | 99.14 | 47.67 | 25.85 | 22.29 | 69.99 | 95.71 |
| 1990-2014 variation | +60.0% | +66.0% | + 50.1% | + 80.8% | +213.2% | + 151.6% |
Primary energy production
Primary energy production in the Philippines by source (Mtep)
| Source | 1990 | % | 2000 | % | 2010 | % | 2011 | 2012 | 2013 | 2014 | % 2014 | var. 2014/1990 |
| Coal | 0.6 | 3.8 | 0.7 | 3.7 | 3.5 | 14.9 | 3.6 | 3.9 | 3.7 | 4.0 | 15.5 | +518% |
| Oil | 0.2 | 1.4 | 0.06 | 0.3 | 1.0 | 4.2 | 0.9 | 0.8 | 0.7 | 0.8 | 3.3 | + 263% |
| Natural gas | 0 | 0,009 | 0.05 | 3.0 | 12.9 | 3.3 | 3.2 | 2.9 | 3.1 | 11.8 | ns | |
| Total fossils | 0.9 | 5.1 | 0.8 | 4.0 | 7.5 | 32.0 | 7.8 | 7.9 | 7.4 | 7.9 | 30.6 | +797% |
| Hydraulic | 0.5 | 3.0 | 0.7 | 3.4 | 0.7 | 2.8 | 0.8 | 0.9 | 0.9 | 0.8 | 3.0 | + 51% |
| Biomass waste | 11.1 | 64.6 | 8.1 | 41.4 | 6.8 | 28.9 | 6.8 | 7.7 | 8.0 | 8.3 | 32.0 | -26% |
| Geothermal, solar, wind | 4.7 | 27.3 | 10.0 | 51.1 | 8.5 | 36.3 | 8.6 | 8.8 | 8.3 | 8.9 | 34.3 | +89% |
| Total energy | 16.3 | 94.9 | 18.8 | 96.0 | 16.0 | 68.0 | 16.2 | 17.4 | 17.1 | 17.9 | 69.4 | + 10% |
| Total | 17.2 | 100 | 19.5 | 100 | 23.5 | 100 | 24.0 | 25.2 | 24.5 | 25.9 | 100 | + 50% |
| Source of data: International Energy Agency . | ||||||||||||
Oil
In 2013, total oil production was 26,000 barrels per day (bl / d) while the country consumed 299,000 bl / d. In May 2014, the government auctioned eleven blocks of oil and gas in the Palawan Basin and surrounding areas, including a block in the South China Sea, according to Reuters. This bidding for exploration could increase oil production to 39,000 bbl / d by 2019. Two of the blocks are located near the Spratleys Islands, some of which are claimed by the Philippines, and which are affected areas. a territorial dispute with China. According to the estimates of the EIA, theSouth China Sea contain about 11 billion barrels of oil and 5,400 billion m3 of natural gas proven and probable reserves.
The Philippines imported about 270 000 bl / d of crude oil and petroleum products in 2013; 35% of their crude imports came from Saudi Arabia and Russia. The Philippines has a refining capacity of 290,000 bl / d. Shell Philippines, a subsidiary of Shell, and Otto Energy play a significant role in the upstream sector, while Petron Corporation operates the largest refinery in the country, providing nearly 40% of the country’s needs. The Philippines export almost all their production of crude oil.
Natural gas
The production of dry natural gas was 2800 million m 3 in 2012, falling steadily since 2008, entirely consumed locally. The Malampaya Deepwater Natural Gas Project is one of the largest foreign energy projects in the country; managed by Shell in a joint venture with Chevron and the PNOC Exploration Corporation, a subsidiary of the Philippine National Oil Company (PNOC). Malampaya covers 30% of the country’s electricity needs.
Primary energy consumption
The primary energy consumption per capita in the Philippines in 2014 was 0.48 toe k1, one quarter of the world average (1.89 toe / capita) and one third to that of Asia (0.72 toe). / hab) k2.
Primary energy consumption in the Philippines by source (Mtep)
| Source | 1990 | % | 2000 | % | 2010 | % | 2011 | 2012 | 2013 | 2014 | % 2014 | var. 2014/1990 |
| Coal | 1.5 | 5.3 | 5.2 | 12.9 | 7.6 | 18.9 | 8.3 | 8.8 | 10.9 | 11.7 | 24.4 | +663% |
| Oil | 10.8 | 37.8 | 16.1 | 40.1 | 13.6 | 33.7 | 12.7 | 13.8 | 13.7 | 14.8 | 31.1 | + 37% |
| Natural gas | 0 | 0,009 | 0.02 | 3.0 | 7.6 | 3.3 | 3.2 | 2.9 | 3.1 | 6.4 | ns | |
| Total fossils | 12.4 | 43.1 | 21.2 | 53.1 | 24.3 | 60.1 | 24.3 | 25.8 | 27.5 | 29.6 | 62.0 | +139% |
| Hydraulic | 0.5 | 1.8 | 0.7 | 1.7 | 0.7 | 1.7 | 0.8 | 0.9 | 0.9 | 0.8 | 1.6 | + 51% |
| Biomass- waste | 11.1 | 38.7 | 8.1 | 20.3 | 6.9 | 17.0 | 6.9 | 7.8 | 8.2 | 8.5 | 17.7 | -24% |
| Geothermal , solar, wind | 4.7 | 16.4 | 10.0 | 25.0 | 8.5 | 21.1 | 8.6 | 8.8 | 8.3 | 8.9 | 18.6 | +89% |
| Total EnR | 16.3 | 56.9 | 18.8 | 46.9 | 16.1 | 39.9 | 16.3 | 17.6 | 17.3 | 18.1 | 38.0 | + 11% |
| Total | 28.7 | 100 | 40.0 | 100 | 40.4 | 100 | 40.7 | 43.3 | 44.8 | 47.7 | 100 | +66% |
| Source of data: International Energy Agency . | ||||||||||||
Electricity sector
Electricity generation
Philippines Electricity Generation by Source (TWh)
| Source | 1990 | % | 2000 | % | 2010 | % | 2011 | 2012 | 2013 | 2014 | % 2014 | var. 2014/1990 |
| Coal | 1.9 | 7.3 | 16.7 | 36.8 | 23.3 | 34.4 | 25.3 | 28.3 | 32.1 | 33.1 | 42.8 | +1609% |
| Oil | 12.4 | 47.2 | 9.2 | 20.3 | 7.1 | 10.5 | 3.4 | 4.3 | 4.5 | 5.7 | 7.4 | -54% |
| Natural gas | 0 | 0.02 | 0.04 | 19.5 | 28.8 | 20.6 | 19.6 | 18.8 | 18.7 | 24.2 | ns | |
| Fossil subtotal | 14.4 | 54.6 | 25.9 | 57.1 | 49.9 | 73.7 | 49.3 | 52.2 | 55.4 | 57.5 | 74.4 | + 300% |
| Hydraulic | 6.1 | 23.0 | 7.8 | 17.2 | 7.8 | 11.5 | 9.7 | 10.3 | 10.0 | 9.1 | 11.8 | + 51% |
| geothermal | 5.5 | 20.8 | 11.6 | 25.7 | 9.9 | 14.7 | 9.9 | 10.3 | 9.6 | 10.3 | 13.3 | +89% |
| Biomass waste | 0.4 | 1.6 | 0 | 0.03 | 0.04 | 0.1 | 0.2 | 0.2 | 0.2 | 0.3 | -55% | |
| Wind, solar | 0 | 0 | 0.06 | 0.09 | 0.09 | 0.08 | 0.07 | 0.17 | 0.2 | ns | ||
| Subtotal EnR | 12.0 | 45.4 | 19.4 | 42.9 | 17.8 | 26.3 | 19.8 | 20.8 | 19.9 | 19.8 | 25.6 | +66% |
| Total | 26.3 | 100 | 45.3 | 100 | 67.7 | 100 | 69.2 | 72.9 | 75.3 | 77.3 | 100 | + 193% |
| Data sources: International Energy Agency . | ||||||||||||
The distribution between regions of the 2013 production was:
Luzon: 54.82 TWh (72.8%)
Visayas: 11.10 TWh (14.7%)
Mindanao: 9.35 TWh (12.4%).
Composition of the power plant park
The Philippines electric generating fleet had a total capacity of 16.2 gigawatts (GW) at the end of 2011 and the government plans to add 11.4 GW by 2030 according to the Filipino Energy Plan of the Philippine Department of Energy. The installed capacity of the hydroelectric plants in the Philippines reached 3.5 GW and that of the 1.8 GW geothermal plants in 2012.
By the end of 2013, the Philippines had 17,325 MW installed (generators connected to the grid), of which 15,371 MW were actually available; the breakdown by source of energy and by network was as follows:
Installed power of plants in the Philippines by source in 2013
| Power ( MW ) | Share (%) | Pointe de | |||
| Source | installed | available | installed | available | demand (MW) |
| Coal | 5,568 | 5,206 | 32.1 | 33.9 | |
| Oil | 3,353 | 2,846 | 19.4 | 18.5 | |
| Natural gas | 2,862 | 2,760 | 16.6 | 18.0 | |
| Hydro | 3,521 | 2,983 | 20.3 | 19.4 | |
| geothermal | 1,868 | 1,482 | 10.8 | 9.6 | |
| Aeolian | 33 | 17 | 0.19 | 0.11 | |
| Solar | 1 | 0 | 0.01 | 0 | |
| biomass | 119 | 76 | 0.68 | 0.50 | |
| Total | 17,325 | 15,371 | 100 | 100 | |
| Distribution by network: | |||||
| Luzon | 12,790 | 11,519 | 73.8 | 74.9 | 8,305 |
| Visayas | 2,448 | 2,103 | 14.1 | 13.7 | 1,572 |
| Mindanao | 2,087 | 1,749 | 12.1 | 11.4 | 1,415 |
| Data Source: Department of Energy, Republic of the Philippines | |||||
The evolution of installed power has been very fast:
Philippines Power Station Installed Capacity by Source (MW)
| Source | 1991 | % | 2000 | % | 2010 | % | 2011 | 2012 | 2013 | % 2013 | var. 2013/1991 |
| Coal | 405 | 6.0 | 3,963 | 30.1 | 4,867 | 29.8 | 4,917 | 5,568 | 5,568 | 32.1 | x 13.75 |
| Oil | 3,341 | 49.2 | 4,987 | 37.8 | 3,193 | 19.5 | 2,994 | 3,074 | 3,353 | 19.4 | + 0.4% |
| Natural gas | 3 | ns | 2,861 | 17.5 | 2,861 | 2,862 | 2,862 | 16.5 | ns | ||
| Hydro | 2,155 | 31.7 | 2,301 | 17.5 | 3,400 | 20.8 | 3,491 | 3,521 | 3,521 | 20.3 | + 63% |
| geothermal | 888 | 13.1 | 1,931 | 14.6 | 1,966 | 12.0 | 1,783 | 1,848 | 1,868 | 10.8 | + 110% |
| Other renewable | 73 | 0.4 | 117 | 153 | 153 | 0.9 | ns | ||||
| Total | 6,789 | 100 | 13,185 | 100 | 16,359 | 100 | 16,162 | 17,025 | 17,325 | 100 | +155% |
| Data Source: Department of Energy, Republic of the Philippines | |||||||||||
Conventional thermal power plants
Nuclear power plants
The Philippines nuclear program began in 1958 with the creation of the Philippine Atomic Energy Commission (PAEC). In 1963, the Philippine Research Reactor (PRR-1) of 1 MW has diverged for the first time. In 1972, the government commissioned a feasibility study for a nuclear power plant at Luzon with the assistance of IAEA and UNDP.
The Bataan Nuclear Power Station (620 MW) was built from 1976 to 1984, under the dictator Ferdinand Marcos, on the Bataan Peninsula in southwestern Luzon (Philippines), 100 km from Manila.
Due to differences between the authorities and the US construction company, Westinghouse Electric Company, however, it never delivered electricity and the government gave up the commissioning in 1986 after the fall of the regime. Marcos.
The construction left the country with an estimated debt of $2.2 billion. Opponents have accused President Marcos and Herminio Disini, one of his relatives who had mediated with Westinghouse, of receiving at least $17 million in bribes; they invoked an investigation which would have revealed 4,000 defects and underline that the site of the power station is at nine kilometers of the Natib volcano located between the fault of the Philippines and the fault of Western Luçon. In 1992, the government of Corazon Aquinonegotiated a settlement agreement with Westinghouse to terminate the lawsuit against Westinghouse and repay the debt at a rate of $ 40 million per year plus US $ 2.9 cents per kWh for 30 years in return for a $ 100 million rebate on the cost of upgrading the plant, as well as a $ 400 million loan from Eximbank to finance this upgrade; but the Philippine parliament rejected this agreement. Finally, a settlement agreement was signed in October 1995. In May 1995, President Ramos announced a nuclear program of 5,000 MW for 2005 and 25,000 MW for 2020; in December 1996 the Department of Energy published a list of ten possible sites for the construction of nuclear power plants. But the opposition managed to prevent this project.
In 2004 President Gloria Macapagal-Arroyo announced that she wanted to convert the Bataan Nuclear Power Plant, which was never started, into a gas-fired power station.
In 2008, the International Atomic Energy Agency (IAEA) sent a team of experts to Bataan at the invitation of the Philippine government. In its recommendations, the IAEA highlighted the fact that the plant needed to be thoroughly examined by qualified experts. It had also indicated to the Philippine government general requirements for developing a national nuclear program. Among them, primarily the need to build appropriate infrastructure, establish high safety standards and develop national expertise.
In February 2011, the state-owned company National Power Corp announced that the Philippine government would pay him 4.2 billion Philippine pesos (70 million euros) in repayment of sums committed for the maintenance of the power station cocooned Bataan .
The Minister of Energy of the Philippines, Jericho Petilla, wishes to submit by the end of 2016 a recommendation on the procedure to be followed for the nuclear power station at the Bataan decision; it even says in favor of additional production capacity on this site if the project Bataan was continued.
Renewable energy
The Renewable Energy Act of 2008 affirms the government’s commitment to accelerate the exploration and development of renewable energy. Under this law, the National Renewable Energy Program (NREP) sets detailed targets for the development of renewable energies, to triple their installed capacity in twenty years, from 5,438 MW in 2010 to 15,304 MW in 2030. Geothermal power expected to increase by 1,495 MW (+ 75%), hydropower by 5,394 MW (+160%), biomass by 277 MW, wind power by 2,345 MW and solar 284 MW; ocean energy projects are also invoked (70.5 MW), with a first plant in 2018. A pumped-storage turbines for seawater are planned for 2030. The network parity is planned to solar in 2020 and for wind in 2025.
To promote renewable energies, incentives have been put in place:
The 2008 Renewable Energy Act establishes net metering, which came into force in July 2013: electricity operators must buy from small solar power producers (<100 kW) the share of their production that exceeds their self-consumption at the average cost of production of electricity. the operator;
the feed-in tariff, approved by the Energy Regulatory Commission in July 2012, is a bonus paid to renewable energy producers (wind and solar) for the electricity they inject into the grid; at 2 centavos per kWh, it is one of the lowest in the world.
Hydroelectricity
The installed capacity of the hydropower plants in the Philippines reached 4 235 MW at the end of 2015, including 685 MW of pumped storage; production reached 9.95 TWh, to 11 th rank of the East Asia and Pacific region 22; they produced 9.14 TWh in 2014, or 11.8% of the electricity produced in the country. In 2012, thanks to more abundant rainfall, they produced 10.25 TWh .
The Philippines commissioned 29 MW in 2015; the country has set a target of 8,724 MW in 2030.
The San Roque Dam on the Agno River on Luzon Island is a multi-purpose development: in addition to generating electricity (345 MW), it is used for irrigation, flood control and improvement. water quality (sediment retention, etc.); built from 1998 to 2003 by San Roque Power Corporation (SRPC) as part of a public-private partnership with the national company NPC, it will be transferred to NPC upon the expiry of this contract (25 years).
The Caliraya dam, built from 1939 to 1942, supplied a 30 MW power plant; from 1948 to 1953, additional work connected Caliraya Lake to Lumbot Lake and raised the dam; in 1983, the 300 MW Kalayaan pumped storage power station was built using the 289-meter difference in elevation between Caliraya Reservoir and Laguna de Bay, 60 km south of Manila; in 1990 phase II of Kalayaan was launched (additional 300 MW); extensions are planned to bring the total power to 2,000 MW. In 2004, the plant had two groups of 168 MW and two of 174 MW, a total of 684 MW.
The Pulangi IV plant on the Pulangi River of Mindanao, built from 1982 to 1986, has an installed capacity of 255 MW.
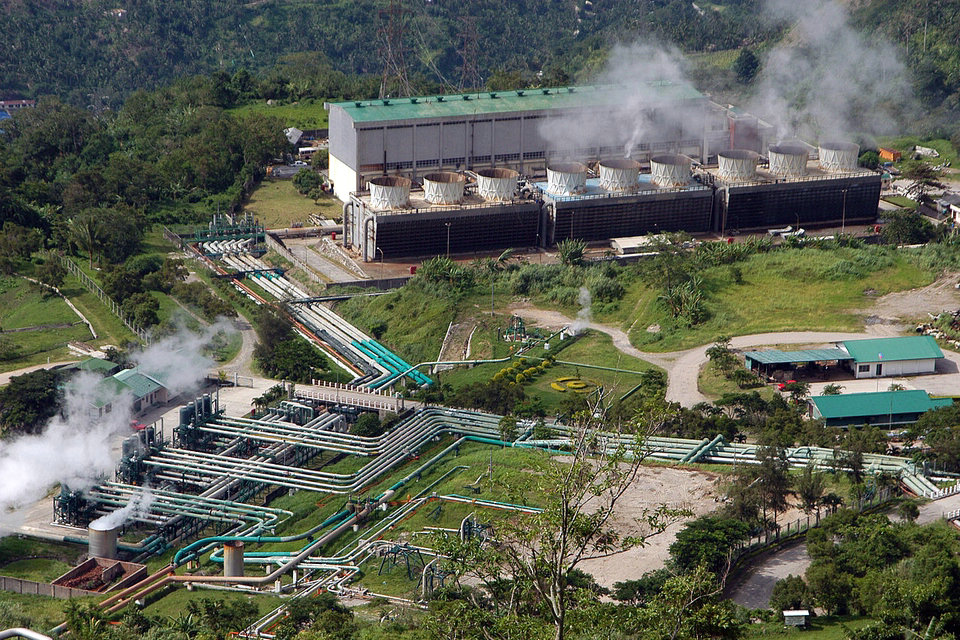
Geothermal
According to the International Geothermal Association (IGA), the installed capacity of geothermal power plants in the Philippines reached 1,870 MW in 2015, down slightly from the peak of 1,931 MW in 2005; it accounted for 14.8% of the global total to 2e world behind the United States (3450 MW). It increased from 891 MW in 1990 to 1227 MW in 1995 and 1,909 MW in 2000 and has changed little since then.
Geothermal power plants produced 10.3 TWh in 2014, or 13.3% of the electricity produced in the country.
The first Philippine geothermal plant, with an output of 3 MW, was commissioned in 1977 on the island of Leyte. Commercial scale production began in 1979 with the commissioning of a 110 MW power plant on the Tiwi field in the Albay province in southeastern Luzon.The Leyte geothermal field consists of five plants:
Malitbog (232.5 MW), commissioned in 1996;
Tongonan 1 (112.5 MW);
Mahanagdong (180 MW);
Upper Mahiao (125 MW);
Leyte optimization (50.9 MW).
The Yolanda typhoon severely damaged the plants’ especially their cooling towers) in November 2013, depriving the electrical system of 650 MW.
Biomass
The production of biomass plants reached 212 GWh in 2013, representing 0.28% of total electricity production, including 60 GWh in Luzon, 106 GWh in the Visayas and 47 GWh in Mindanao.
The Central Landfill Rodriguez (7.6 MW), commissioned in 2009 at Rizal (Cagayan) by Montalban Methane Power Corp., is the first plant of commercial size landfill gas the Philippines.
Wind
At the end of 2016, the Philippines ranked 8 th in Asia for their installed wind power capacity of 216 MW, far behind China (168,690 MW) and India (28,700 MW). They have not carried out any new installations in the years 2015 and 2016.
Wind generation reached 65.7 GWh in 2013, or 0.09% of total electricity generation, all of which was in Luçon.
The Windpower database lists Filipino wind farms totaling 390 MW in February 2016 34, and lists their full.
The National Renewable Energy Program (NREP) plans to install 2,345 MW of wind turbines between 2011 and 2030, divided among 57 park projects, including 45 in Luzon (2,103 MW), 11 in the Visayas (227 MW) and one in Mindanao (15 MW). The most important projects are Prieto Diaz II (420 MW), Pasuquin (120 MW), Mt. Redondo (112 MW), North Pasuquin (100 MW) and Mercedes (100 MW).
Solar
The output of solar power plants reached 1.4 GWh in 2013, or 0.002% of total electricity production, all of which was in Mindanao.
The National Renewable Energy Program (NREP) plans to install 284 MW of solar energy between 2011 and 2030, divided between 20 park projects, including 15 in Luzon (228 MW), 3 in Visayas (34 MW) and 2 in Mindanao. (22 MW). The most important projects are those of Pasuquin-Burgos (50 MW), Clark Freeport Zone (50 MW) and Cavite Export Zone (50 MW).
A solar farm with a total capacity of 132 MWp, the largest installed in South East Asia, was built from May 2015 to March 2016 on the island of Negros by Bouygues Construction; more than 425,000 panels were laid on an area of 170 ha; the plant will have an annual output of 190 GWh.
Final electricity consumption
Per capita electricity consumption in the Philippines in 2014 was 706 kWh k 1, 77% lower than the world average (3,030 kWh / inhabitant) and 25% lower than Asia (947 kWh / inhab) k2.
The sectoral breakdown of final electricity consumption has evolved as follows:
Philippines final electricity consumption by sector (TWh)
| Sector | 1990 | % | 2000 | % | 2010 | % | 2011 | 2012 | 2013 | 2014 | % 2014 | var. 2014/1990 |
| Industry | 9.9 | 46.9 | 13.2 | 36.1 | 18.6 | 33.6 | 19.3 | 20.1 | 20.7 | 21.4 | 33.8 | + 115% |
| Transport | 0 | 0.06 | 0.2 | 0.1 | 0.2 | 0.1 | 0.1 | 0.1 | 0.1 | 0.2 | ns | |
| Residential | 5.6 | 26.4 | 12.9 | 35.3 | 18.8 | 34.1 | 18.7 | 19.7 | 20.6 | 21.0 | 33.1 | +274% |
| Tertiary | 5.2 | 24.3 | 10.1 | 27.7 | 16.3 | 29.4 | 16.6 | 17.8 | 18.3 | 18.8 | 29.6 | + 264% |
| Agriculture | 0.5 | 2.4 | 0.3 | 0.8 | 1.3 | 2.4 | 1.2 | 1.4 | 1.6 | 1.8 | 2.9 | + 264% |
| Peach | 0 | 0 | 0.2 | 0.3 | 0.2 | 0.2 | 0.2 | 0.2 | 0.4 | ns | ||
| Total | 21.2 | 100 | 36.6 | 100 | 55.3 | 100 | 56.1 | 59.2 | 61.6 | 63.3 | 100 | +199% |
| Source of data: International Energy Agency. | ||||||||||||
Environmental impact
CO 2 emissionsrelated to energy in the Philippines in 2014 was 95.71 Mt CO 2k 3, ie 0.97 Mt per capita k 1, equal to 21.7% of the world average: 4.47 Mt / inhabitant and 61% of that of Asia: 1.58 Mt / inhabitant k 2.
CO 2 emissions related to energy by consumption sector *
| 2013 issues | part of the sector | Emissions / capita | TX. / Cap. EU-28 | |
| Sector | Million tons CO 2 | % | CO 2 tons/ Hab. | CO 2 tons/ Hab. |
| Energy sector excluding elec. | 1.2 | 1% | 0.01 | 0.41 |
| Industry and construction | 27.7 | 31% | 0.28 | 1.67 |
| Transport | 25.6 | 29% | 0.26 | 1.74 |
| of which road transport | 22.3 | 25% | 0.23 | 1.61 |
| Residential | 16.9 | 19% | 0.17 | 1.58 |
| Other | 18.2 | 20% | 0.18 | 1.17 |
| Total | 89.6 | 100% | 0.91 | 6.57 |
| Source: International Energy Agency * after re-allocation of electricity and heat generation emissions to consumption sectors |
||||
|---|---|---|---|---|
Source from Wikipedia