Ecological footprint

The ecological footprint measures human demand on nature, i.e., the quantity of nature it takes to support people or an economy. It tracks this demand through an ecological accounting system. The accounts contrast the biologically productive area people use for their consumption to the biologically productive area available within a region or the world (biocapacity – the productive area that can regenerate what people demand from nature). In short, it is a measure of human impact on Earth’s ecosystem and reveals the dependence of the human economy on natural capital.
The ecological footprint is defined as the biologically productive area needed to provide for everything people use: fruits and vegetables, fish, wood, fibers, absorption of carbon dioxide from fossil fuel use, and space for buildings and roads.
Footprint and biocapacity can be compared at the individual, regional, national or global scale. Both footprint and biocapacity change every year with number of people, per person consumption, efficiency of production, and productivity of ecosystems. At a global scale, footprint assessments show how big humanity’s demand is compared to what planet Earth can renew. Global Footprint Network calculates the ecological footprint from UN and other data for the world as a whole and for over 200 nations. They estimate that as of 2013, humanity has been using natural capital 1.6 times as fast as nature can renew it.
Ecological footprint analysis is widely used around the Earth in support of sustainability assessments. It can be used to measure and manage the use of resources throughout the economy and explore the sustainability of individual lifestyles, goods and services, organizations, industry sectors, neighborhoods, cities, regions and nations. Since 2006, a first set of ecological footprint standards exist that detail both communication and calculation procedures. The latest version are the updated standards from 2009.
Overview
The first academic publication about ecological footprints was by William Rees in 1992. The ecological footprint concept and calculation method was developed as the PhD dissertation of Mathis Wackernagel, under Rees’ supervision at the University of British Columbia in Vancouver, Canada, from 1990–1994. Originally, Wackernagel and Rees called the concept “appropriated carrying capacity”. To make the idea more accessible, Rees came up with the term “ecological footprint”, inspired by a computer technician who praised his new computer’s “small footprint on the desk”. In early 1996, Wackernagel and Rees published the book Our Ecological Footprint: Reducing Human Impact on the Earth with illustrations by Phil Testemale.
Footprint values at the end of a survey are categorized for Carbon, Food, Housing, and Goods and Services as well as the total footprint number of Earths needed to sustain the world’s population at that level of consumption. This approach can also be applied to an activity such as the manufacturing of a product or driving of a car. This resource accounting is similar to life-cycle analysis wherein the consumption of energy, biomass (food, fiber), building material, water and other resources are converted into a normalized measure of land area called global hectares (gha).
Per capita ecological footprint (EF), or ecological footprint analysis (EFA), is a means of comparing consumption and lifestyles, and checking this against nature’s ability to provide for this consumption. The tool can inform policy by examining to what extent a nation uses more (or less) than is available within its territory, or to what extent the nation’s lifestyle would be replicable worldwide. The footprint can also be a useful tool to educate people about carrying capacity and overconsumption, with the aim of altering personal behavior. Ecological footprints may be used to argue that many current lifestyles are not sustainable. Such a global comparison also clearly shows the inequalities of resource use on this planet at the beginning of the twenty-first century.
In 2007, the average biologically productive area per person worldwide was approximately 1.8 global hectares (gha) per capita. The U.S. footprint per capita was 9.0 gha, and that of Switzerland was 5.6 gha, while China’s was 1.8 gha. The WWF claims that the human footprint has exceeded the biocapacity (the available supply of natural resources) of the planet by 20%. Wackernagel and Rees originally estimated that the available biological capacity for the 6 billion people on Earth at that time was about 1.3 hectares per person, which is smaller than the 1.8 global hectares published for 2006, because the initial studies neither used global hectares nor included bioproductive marine areas.
A number of NGOs offer ecological footprint calculators (see Footprint Calculator, below).
Calculation
The calculation of the ecological footprint is complex, and in some cases impossible, what constitutes its main limitation as an indicator; In any case, there are different estimation methods based on the analysis of the resources consumed by a person and the waste they produce. The amount of hectares used to develop, generate infrastructures and work centers.
Hectares necessary to provide the necessary plant food.
Area needed for pastures that feed livestock.
Marine surface necessary to produce fish.
Hectares of forest necessary to assume the CO 2 that causes our energy consumption. In this sense, not only the degree of energy efficiency reached but also the sources used to obtain it would be affected: the greater the use of renewable energies, the lower the ecological footprint.
From a global point of view, it has been estimated in 1.8 ha 2 the biocapacity of the planet for each inhabitant, or what is the same, if we had to distribute the productive land of the land in equal parts, to each of The more than six billion inhabitants of the planet, they would correspond 1.8 hectares to meet all their needs for a year. With 2005 data, the average consumption per inhabitant per year is 2.7 hectares, so, globally, we are consuming more resources and generating more waste than the planet can generate and admit.
Footprint measurements and methodology
In 2013, the Global Footprint Network estimated the global ecological footprint as 1.6 planet Earths. This means that, according to their calculations, the planet’s ecological services were being used 1.6 times faster than they were being renewed.
Ecological footprints can be calculated at any scale: for an activity, a person, a community, a city, a town, a region, a nation, or humanity as a whole. Cities, due to population concentration, have large ecological footprints and have become ground zero for footprint reduction.
The ecological footprint accounting method at the national level is described on the web page of Global Footprint Network or in greater detail in an academic paper.
The National Accounts Review Committee has also published a research agenda on how to improve the accounts.
Methodology
The ecological footprint accounting method at the national level is described on the web page of Global Footprint Network or in greater detail in an academic paper.
While not representing human demand in every single last detail, this number gives an overarching estimate to what extent human demand operates within the means of planet Earth. While improvements are still possible, there are already standards available since 2006, with updates in 2009.
The National Accounts Review Committee has also published a research agenda on how to improve the accounts.
Studies in the United Kingdom
The UK’s average ecological footprint is 5.45 global hectares per capita (gha) with variations between regions ranging from 4.80 gha (Wales) to 5.56 gha (East England).
Two recent studies have examined relatively low-impact small communities. BedZED, a 96-home mixed-income housing development in South London, was designed by Bill Dunster Architects and sustainability consultants BioRegional for the Peabody Trust. Despite being populated by relatively “mainstream” home-buyers, BedZED was found to have a footprint of 3.20 gha due to on-site renewable energy production, energy-efficient architecture, and an extensive green lifestyles program that included on-site London’s first carsharing club. The report did not measure the added footprint of the 15,000 visitors who have toured BedZED since its completion in 2002. Findhorn Ecovillage, a rural intentional community in Moray, Scotland, had a total footprint of 2.56 gha, including both the many guests and visitors who travel to the community to undertake residential courses there and the nearby campus of Cluny Hill College. However, the residents alone have a footprint of 2.71 gha, a little over half the UK national average and one of the lowest ecological footprints of any community measured so far in the industrialized world. Keveral Farm, an organic farming community in Cornwall, was found to have a footprint of 2.4 gha, though with substantial differences in footprints among community members.
Ecological footprint at the individual level
In a 2012 study of consumers acting “green” vs. “brown” (where green people are «expected to have significantly lower ecological impact than “brown” consumers»), the conclusion was “the research found no significant difference between the carbon footprints of green and brown consumers”. A 2013 study concluded the same.
A 2017 study published in Environmental Research Letters posited that the most significant way individuals could reduce their own carbon footprint is to have fewer children, followed by living without a vehicle, forgoing air travel and adopting a plant-based diet.
Biocapacity
Over the entire land surface (about 51 billion hectares), it is estimated that about 12 billion hectares (terrestrial and aquatic) are bioproductive in the sense that they create a certain amount of organic matter every year thanks to the photosynthesis. In deserts and most of the oceans, photosynthesis also exists but is too diffuse for its products to be exploited by humans.
There are five types of bioproductive surfaces (2009 data):
cultivated fields (about 1.6 billion ha);
pastures (about 3.4 billion ha);
forests (about 3.9 billion ha);
fisheries (about 2.9 billion ha);
land built (in fact, it is assumed that cities were most often built on arable land) (about 0.2 billion ha).
In order to aggregate these different surfaces, they are converted into a new unit, the global hectare (hag), which represents one hectare of average bioproductivity on Earth in a given year. The weight of each type of surface is thus modified, which is explained by the fact that they do not all produce the same quantity of services (one hectare of pasture is for example less productive than one hectare of crops).
At the national level, the calculation of the biocapacity for each type of surface takes into account the productivity of the country compared to the world average. This productivity is below or above average due to differences in available technology, climate, soil quality…
It should be noted that unsustainable farming practices can increase the biocapacity of the land in question: the ecological footprint is not a predictive tool and therefore notes the instantaneous gains generated by these practices. However, the footprint may reflect a possible deterioration in the future: polluted soils will see their productivity and therefore their biocapacity decrease.
Ecological Footprint
Human activities consume resources and produce waste. Five types of bioproductive surfaces correspond to six types of footprints (5 for resources, one for a type of waste: CO2)
cultivated fields
pastures
forests for wood
forests for carbon sequestration (or carbon footprint)
fisheries
built land
Forests therefore offer two different and competing services: providing wood-based products or sequestering some of the carbon emitted by humans. Forests can not provide both services at the same time: if it is desired that part of the forests sequester CO2 in the long run, you have to agree to never cut them.
The simplified example that follows makes it possible to understand the calculation principle used for each partial impression: 10 tons of wood are necessary for a given activity; however, the average productivity of forests in the world is 2 tons of wood per hectare per year. The activity therefore mobilizes 5 hectares of forests. We can then transform the 5 hectares of forests into global hectares, which will make it possible to aggregate the different partial footprints.
Global Orders and Trends
With a biocapacity of about 12.22 Ghag (billion “global hectares”) and a population of 7.3 billion men, the available biocapacity per person in 2014 was 1.68 hag (“global hectares”).). In 2014, an average Tertian needed 2.84 hag. The overrun was therefore 69%, that is, it would have taken 1.69 planets to provide sustainable human consumption in 2014.
The global ecological footprint has in fact exceeded the Earth’s biological capacity to produce our resources and absorb our waste since the mid-1980s, which means that we are already over- consuming the reserves, in fact by over-exploiting the environment.
The upward trend has not yet been reversed, due to the difficulty of changing consumption and production patterns, despite the commitments and goals of sustainable development established at the Rio Earth Summit in Rio de Janeiro. 1992 and Johannesburg in 2002.
Orders of magnitude larger geographic areas
Some benchmarks for the year 2014:
The global average ecological footprint is 2.84 hag per person while the average biocapacity is 1.68 hag per person; therefore it takes 1,69 Earth to cover the consumption of humanity;
A Frenchman needs 4.7 hag to maintain his standard of living. If all humans consumed as much as a Frenchman, we would need 2.79 planets;
An American needs 8.37 hag for consumption. If all humans consumed as an American, it would require 4.97 planets;
A Brazilian has an ecological footprint of 3.08 hag (1.83 planet);
A Chinese has a footprint of 3.71 hag (2.21 planets);
An Indian has a footprint of 1.12 hag (0.67 planet).
a Haitian has a footprint of 0.67 hag (0.4 planet).
Reviews and critiques
Early criticism was published by van den Bergh and Verbruggen in 1999, which was updated in 2014. Another criticism was published in 2008. A more complete review commissioned by the Directorate-General for the Environment (European Commission) was published in June 2008. The review found Ecological Footprint “a useful indicator for assessing progress on the EU’s Resource Strategy” the authors noted that Ecological Footprint analysis was unique “in its ability to relate resource use to the concept of carrying capacity.” The review noted that further improvements in data quality, methodologies and assumptions were needed.
A recent critique of the concept is due to Blomqvist et al., 2013a, with a reply from Rees and Wackernagel, 2013, and a rejoinder by Blomqvist et al., 2013b.
An additional strand of critique is due to Giampietro and Saltelli (2014a), with a reply from Goldfinger et al., 2014, a rejoinder by Giampietro and Saltelli (2014a), and additional comments from van den Bergh and Grazi (2015).
A number of countries have engaged in research collaborations to test the validity of the method. This includes Switzerland, Germany, United Arab Emirates, and Belgium.
Grazi et al. (2007) have performed a systematic comparison of the ecological footprint method with spatial welfare analysis that includes environmental externalities, agglomeration effects and trade advantages. They find that the two methods can lead to very distinct, and even opposite, rankings of different spatial patterns of economic activity. However this should not be surprising, since the two methods address different research questions.
Newman (2006) has argued that the ecological footprint concept may have an anti-urban bias, as it does not consider the opportunities created by urban growth. Calculating the ecological footprint for densely populated areas, such as a city or small country with a comparatively large population — e.g. New York and Singapore respectively — may lead to the perception of these populations as “parasitic”. This is because these communities have little intrinsic biocapacity, and instead must rely upon large hinterlands. Critics argue that this is a dubious characterization since mechanized rural farmers in developed nations may easily consume more resources than urban inhabitants, due to transportation requirements and the unavailability of economies of scale. Furthermore, such moral conclusions seem to be an argument for autarky. Some even take this train of thought a step further, claiming that the Footprint denies the benefits of trade. Therefore, the critics argue that the Footprint can only be applied globally.
The method seems to reward the replacement of original ecosystems with high-productivity agricultural monocultures by assigning a higher biocapacity to such regions. For example, replacing ancient woodlands or tropical forests with monoculture forests or plantations may improve the ecological footprint. Similarly, if organic farming yields were lower than those of conventional methods, this could result in the former being “penalized” with a larger ecological footprint. Of course, this insight, while valid, stems from the idea of using the footprint as one’s only metric. If the use of ecological footprints are complemented with other indicators, such as one for biodiversity, the problem might be solved. Indeed, WWF’s Living Planet Report complements the biennial Footprint calculations with the Living Planet Index of biodiversity. Manfred Lenzen and Shauna Murray have created a modified Ecological Footprint that takes biodiversity into account for use in Australia.
Although the ecological footprint model prior to 2008 treated nuclear power in the same manner as coal power, the actual real world effects of the two are radically different. A life cycle analysis centered on the Swedish Forsmark Nuclear Power Plant estimated carbon dioxide emissions at 3.10 g/kW⋅h and 5.05 g/kW⋅h in 2002 for the Torness Nuclear Power Station. This compares to 11 g/kW⋅h for hydroelectric power, 950 g/kW⋅h for installed coal, 900 g/kW⋅h for oil and 600 g/kW⋅h for natural gas generation in the United States in 1999. Figures released by Mark Hertsgaard, however, show that because of the delays in building nuclear plants and the costs involved, investments in energy efficiency and renewable energies have seven times the return on investment of investments in nuclear energy.
The Swedish utility Vattenfall did a study of full life-cycle greenhouse-gas emissions of energy sources the utility uses to produce electricity, namely: Nuclear, Hydro, Coal, Gas, Solar Cell, Peat and Wind. The net result of the study was that nuclear power produced 3.3 grams of carbon dioxide per kW⋅h of produced power. This compares to 400 for natural gas and 700 for coal (according to this study). The study also concluded that nuclear power produced the smallest amount of CO2 of any of their electricity sources.
Claims exist that the problems of nuclear waste do not come anywhere close to approaching the problems of fossil fuel waste. A 2004 article from the BBC states: “The World Health Organization (WHO) says 3 million people are killed worldwide by outdoor air pollution annually from vehicles and industrial emissions, and 1.6 million indoors through using solid fuel.” In the U.S. alone, fossil fuel waste kills 20,000 people each year. A coal power plant releases 100 times as much radiation as a nuclear power plant of the same wattage. It is estimated that during 1982, US coal burning released 155 times as much radioactivity into the atmosphere as the Three Mile Island incident. In addition, fossil fuel waste causes global warming, which leads to increased deaths from hurricanes, flooding, and other weather events. The World Nuclear Association provides a comparison of deaths due to accidents among different forms of energy production. In their comparison, deaths per TW-yr of electricity produced (in UK and USA) from 1970 to 1992 are quoted as 885 for hydropower, 342 for coal, 85 for natural gas, and 8 for nuclear.
The Western Australian government State of the Environment Report included an Ecological Footprint measure for the average Western Australian seven times the average footprint per person on the planet in 2007, a total of about 15 hectares.
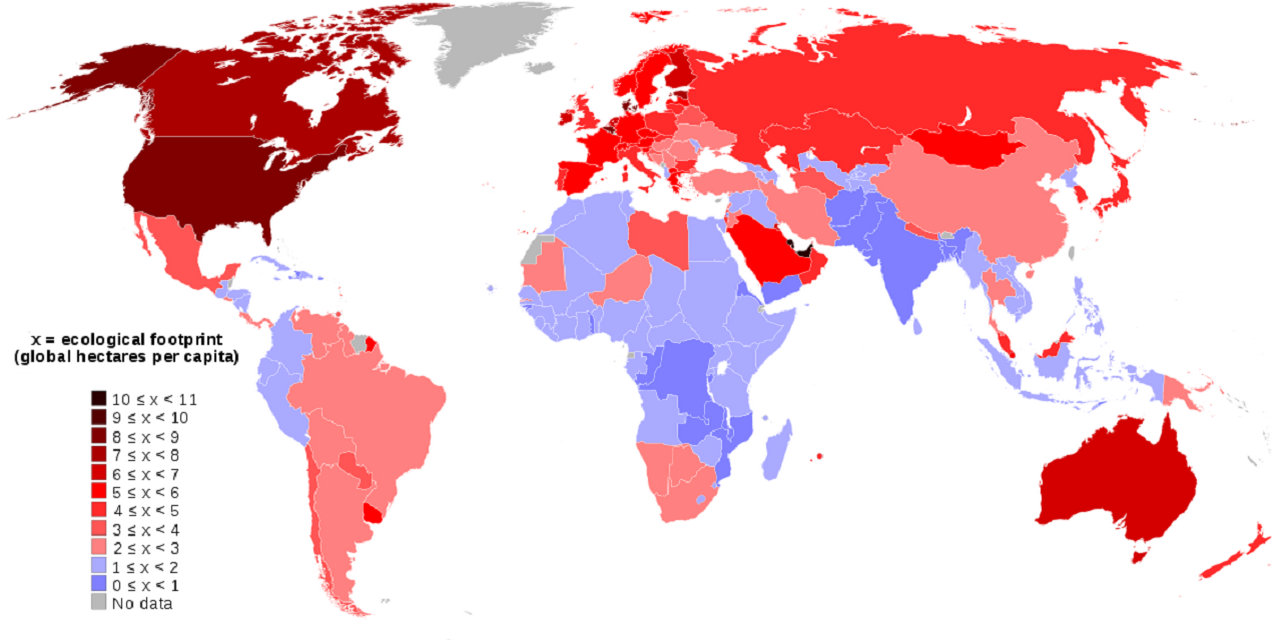
Footprint by country
The world-average ecological footprint in 2013 was 2.8 global hectares per person. The average per country ranges from over 10 to under 1 global hectares per person. There is also a high variation within countries, based on individual lifestyle and economic possibilities.
The GHG footprint or the more narrow carbon footprint are a component of the ecological footprint. Often, when only the carbon footprint is reported, it is expressed in weight of CO2 (or CO2e representing GHG warming potential (GGWP)), but it can also be expressed in land areas like ecological footprints. Both can be applied to products, people or whole societies.
Implications
… the average world citizen has an eco-footprint of about 2.7 global average hectares while there are only 2.1 global hectare of bioproductive land and water per capita on earth. This means that humanity has already overshot global biocapacity by 30% and now lives unsustainabily by depleting stocks of “natural capital”
Discussions and interpretations
Citizenship Tool
Once the basic data are available, the ecological footprint allows everyone to transparently:
use available statistics to calculate the territory that it occupies;
better understand the interdependence of urban and rural areas;
better take into account the impact of the globalization of economies, relocations;
measure how far we have come or go to achieve sustainable or equitable development;
visualize and prioritize issues (in a very educational way);
metaphorically translate the basic levels of supply and demand into natural or fossil resources;
since supply is given at a given moment “t” by the limits of the biosphere, it diminishes with the overexploitation of fossil and living resources, with the degradation of ecosystems (deforestation, desertification, erosion and degradation of soils, groundwater, estuaries and marine ecosystems that reduce the surface of productive ecosystems), and perhaps soon with marine invasions or climatic hazards related to the anthropogenic greenhouse effect;
the demand varies with the standard of living, the personal or cultural preferences, but also, and legitimately, with the climate, the seasons, the repair needs linked to wars and climatic hazards.
Moreover, the ecological footprint makes it possible to precisely visualize the inequality of the consequences of economic development on the different territories and populations. Its calculation for different situations indeed allows several eloquent operations:
compare the situation of different territories and their evolution;
to show the dependence of a territory on others, often poorer, to restore more just and equitable relations;
to show that with our wasteful development and travel patterns, those who enjoy a standard of living considered simply correct already take more than their “legitimate” and sustainable share, even if they pay this “privilege” at a price considered “normal” determined by the market (environmental taxes could also be based on the ecological footprint).
The ecological footprint is thus an irreplaceable educational tool to demonstrate the links between the more or less sustainable nature of development and the increase in inequalities.
Ecological footprint and inequality
A weak ecological footprint can be chosen or experienced, more or less easily or with difficulty depending on the productivity of the environment in which we live, and the number of people who need to take the resources necessary for their lives. Men are not equal either to the geography of the consequences of climatic and ecological disturbances. The poorest countries still have a per capita ecological footprint below the average level that would be bearable by the planet, but aspire to develop and generally have high demographics.
Some evoke a double ecological debt:
rich countries towards poor countries;
and current generations towards future generations.
The former “borrow” (without paying them or not paying them the right price, as long as there are no high taxes) huge areas of natural resources, arable land, forests, mainly located in the countries from South. They export part of their pollution (and in particular those that do not know a border, including greenhouse gases).
Global inequality in and access to bioproducive resources is found at the national, regional and local levels. As a first approximation, the ecological footprint of households is proportional to their consumption, and therefore to their income, if one thinks at a given moment of time. People with very low purchasing power do not fly or buy 4×4 or luxury homes, nor do they have access to organic food, low-energy appliances or HQE.
Another aspect of the relationship between ecological issues and social inequalities is reflected in the importance that international organizations place on the UN’s “millennium goals”, aimed at sharply reducing poverty. It is rarely recalled that these goals can only be achieved by integrating environmental issues. But the evolution of the ecological footprint shows that these goals imply calling into question the “dogma of continuous economic and material growth”.
In the case of climate change, the increase in the ecological footprint per person associated with economic and demographic growth is reflected in other alarming signals, evidenced by numerous scientific works:
acceleration of global warming in the recent period, largely related to human- induced emissions of greenhouse gases, mainly methane and CO2;
beyond a two-degree warming compared to the pre-industrial era (we are currently at one degree, and given past and current emissions, we will reach 1.5 degrees in the near future), disasters global human resources are predictable: droughts, floods and storms, forest fires, rising sea levels, etc.;
during the xxi th century, based on current trends, the warming will be between 2 degrees and 6 degrees, without evoking much more pessimistic scenarios but not devoid of foundation.
These disasters will first affect the poorest people on the planet who are most dependent on climate “hazards”. They could negate the millennium goals for 2015, and provoke regressions beyond. It is estimated that 90% of those affected by “natural” disasters related to global warming live in poor countries or regions. According to the Red Cross and Red Crescent, the number of people severely affected by such disasters increased from 740 million in the 1970s to more than 2 billion in the 1990s. The corresponding economic losses would have increased from 131 billion to 629 billion, more than ten years of official development assistance. According to UNEP (United Nations Environment Program), the cost of global warming doubles every ten years. Half of the world’s population lives in coastal areas that would be submerged if sea levels rise by one meter, a possible assessment for the next century if current trends persist. These new decreases in the available area would result in an increase in the constraint of the ecological footprint. In concrete terms, it would be expected in the coming decades to massive migrations of “environmental refugees”: twenty million before the end of the century just for Bangladesh, one hundred and fifty million in the world by 2050 according to Oxford researchers.
We know that the planet and life will adapt one way or another. But if one thinks of the solutions that will have to be implemented to “save the planet” (which will come out one way or another, this formula refers to human and social life, as well as its quality), the problem of increasing the constraints of the ecological footprint is reflected in the foreground in the increase of inequalities. The social acceptability of the prospects of drastically reducing man’s ecological pressure is not self-evident. Two conditions seem necessary for this. The first is information about the damage today and the debate about the risks of pursuing the current path and alternatives. Without this condition, Awareness will be delayed and urgency will dictate decisions orchestrated authoritatively by politicians and specialists in the name of major disasters that they have not been able to prevent. This is unfortunately what seems most likely today. The second concerns justice. The economic and mental reconversion efforts and the transformation of lifestyles that await us in all conceivable scenarios will be unbearable if they are not accompanied by a sharp reduction in social inequalities, in the world and in each country.
Limits
The calculation of the ecological footprint does not take into account:
the biocapacity necessary for other living species (this is therefore a maximum limit);
the tendency to reduce this area in some regions of the world, which could be further aggravated by the rise of the oceans, and by their acidification;
the total footprint of electricity consumption, and in particular that of nuclear energy, which in fact also has a significant ecological footprint, due to certain characteristics of this sector: extraction and processing of uranium ore, waste nuclear, warming water or high consumption of water for cooling by dry cooling, construction and destruction of plants in later life, restatement of corresponding waste, open cycle, proliferation risks… the impact of valuation methods do not yet do consensus.In the 2006 WWF report, the nuclear electricity footprint is estimated to be equivalent to the same amount of electricity generated by fossil fuels, a position discussed and revised from 2008; the footprint of electricity, of which nuclear is not taken into account in the calculation.
Experts nevertheless provide useful estimates for the prospective assessment of ecological footprint by type of energy. For example, for fossil fuels, especially oil, studies published in the 2000s on peak oil have sought to define innovative strategies. The peak oil consumption was then forecast between 2015 and 2025 according to experts, but the shale oil boom has postponed the deadline of several decades.
Some authors, such as Nicole Stricker, believe that the quantity of water consumed or degraded by the various energy options or the mitigation of greenhouse gas emissions should also be better quantified (for example, if agrofuels in addition to consuming large amounts of surfaces also use plants that consume a lot of water.
Source from Wikipedia