The CIE 1931 color spaces were the first defined quantitative links between distributions of wavelengths in the electromagnetic visible spectrum, and physiological perceived colors in human color vision. The mathematical relationships that define these color spaces are essential tools for color management, important when dealing with color inks, illuminated displays, and recording devices such as digital cameras.
The CIE 1931 RGB color space and CIE 1931 XYZ color space were created by the International Commission on Illumination (CIE) in 1931. They resulted from a series of experiments done in the late 1920s by William David Wright and John Guild. The experimental results were combined into the specification of the CIE RGB color space, from which the CIE XYZ color space was derived.
The CIE 1931 color spaces are still widely used, as is the 1976 CIELUV color space.
Tristimulus values
The human eye with normal vision has three kinds of cone cells that sense light, having peaks of spectral sensitivity in short (“S”, 420 nm – 440 nm), middle (“M”, 530 nm – 540 nm), and long (“L”, 560 nm – 580 nm) wavelengths. These cone cells underlie human color perception in conditions of medium and high brightness; in very dim light color vision diminishes, and the low-brightness, monochromatic “night vision” receptors, denominated “rod cells”, become effective. Thus, three parameters corresponding to levels of stimulus of the three kinds of cone cells, in principle describe any human color sensation. Weighting a total light power spectrum by the individual spectral sensitivities of the three kinds of cone cells renders three effective values of stimulus; these three values compose a tristimulus specification of the objective color of the light spectrum. The three parameters, denoted “S”, “M”, and “L”, are indicated using a 3-dimensional space denominated the “LMS color space”, which is one of many color spaces devised to quantify human color vision.
A color space maps a range of physically produced colors from mixed light, pigments, etc. to an objective description of color sensations registered in the human eye, typically in terms of tristimulus values, but not usually in the LMS color space defined by the spectral sensitivities of the cone cells. The tristimulus values associated with a color space can be conceptualized as amounts of three primary colors in a tri-chromatic, additive color model. In some color spaces, including the LMS and XYZ spaces, the primary colors used are not real colors in the sense that they cannot be generated in any light spectrum.
The CIE XYZ color space encompasses all color sensations that are visible to a person with average eyesight. That is why CIE XYZ (Tristimulus values) is a device-invariant representation of color. It serves as a standard reference against which many other color spaces are defined. A set of color-matching functions, like the spectral sensitivity curves of the LMS color space, but not restricted to non-negative sensitivities, associates physically produced light spectra with specific tristimulus values.
Consider two light sources composed of different mixtures of various wavelengths. Such light sources may appear to be the same color; this effect is denominated “metamerism”. Such light sources have the same apparent color to an observer when they produce the same tristimulus values, regardless of the spectral power distributions of the sources.
Most wavelengths stimulate two or all three kinds of cone cell because the spectral sensitivity curves of the three kinds overlap. Certain tristimulus values are thus physically impossible, for example LMS tristimulus values that are non-zero for the M component and zero for both the L and S components. Furthermore, LMS tristimulus values for pure spectral colors would, in any normal trichromatic additive color space, e. g. the RGB color spaces, imply negative values for at least one of the three primaries because the chromaticity would be outside the color triangle defined by the primary colors. To avoid these negative RGB values, and to have one component that describes the perceived brightness, “imaginary” primary colors and corresponding color-matching functions were formulated. The CIE 1931 color space defines the resulting tristimulus values, in which they are denoted by “X”, “Y”, and “Z”. In XYZ space, all combinations of non-negative coordinates are meaningful, but many, such as the primary locations [1, 0, 0], [0, 1, 0], and [0, 0, 1], correspond to imaginary colors outside the space of possible LMS coordinates; imaginary colors do not correspond to any spectral distribution of wavelengths and therefore have no physical reality.
Meaning of X, Y and Z
When judging the relative luminance (brightness) of different colors in well-lit situations, humans tend to perceive light within the green parts of the spectrum as brighter than red or blue light of equal power. The luminosity function that describes the perceived brightnesses of different wavelengths is thus roughly analogous to the spectral sensitivity of M cones.
The CIE model capitalises on this fact by defining Y as luminance. Z is quasi-equal to blue stimulation, or the S cone response, and X is a mix (a linear combination) of cone response curves chosen to be nonnegative. The XYZ tristimulus values are thus analogous to, but different from, the LMS cone responses of the human eye. Defining Y as luminance has the useful result that for any given Y value, the XZ plane will contain all possible chromaticities at that luminance.
The unit of the tristimulus values X, Y, and Z is often arbitrarily chosen so that Y = 1 or Y = 100 is the brightest white that a color display supports. The corresponding whitepoint values for X and Z can then be inferred using the standard illuminants.
CIE standard observer
Due to the distribution of cones in the eye, the tristimulus values depend on the observer’s field of view. To eliminate this variable, the CIE defined a color-mapping function called the standard (colorimetric) observer, to represent an average human’s chromatic response within a 2° arc inside the fovea. This angle was chosen owing to the belief that the color-sensitive cones resided within a 2° arc of the fovea. Thus the CIE 1931 Standard Observer function is also known as the CIE 1931 2° Standard Observer. A more modern but less-used alternative is the CIE 1964 10° Standard Observer, which is derived from the work of Stiles and Burch, and Speranskaya.
For the 10° experiments, the observers were instructed to ignore the central 2° spot. The 1964 Supplementary Standard Observer function is recommended when dealing with more than about a 4° field of view. Both standard observer functions are discretized at 5 nm wavelength intervals from 380 nm to 780 nm and distributed by the CIE. All corresponding values have been calculated from experimentally obtained data using interpolation. The standard observer is characterized by three color matching functions.
The derivation of the CIE standard observer from color matching experiments is given below, after the description of the CIE RGB space.
Color matching functions
The CIE’s color matching functions , and are the numerical description of the chromatic response of the observer (described above). They can be thought of as the spectral sensitivity curves of three linear light detectors yielding the CIE tristimulus values X, Y and Z. Collectively, these three functions are known as the CIE standard observer.


Other observers, such as for the CIE RGB space or other RGB color spaces, are defined by other sets of three color-matching functions, and lead to tristimulus values in those other spaces.
Computing XYZ From Spectral Data
Emissive Case
The tristimulus values for a color with a spectral radiance Le,Ω,λ are given in terms of the standard observer by:


where is the wavelength of the equivalent monochromatic light (measured in nanometers), and the standard limits of the integral areLe,Ω,λ in [380,780]}.

 is the wavelength of the equivalent monochromatic light (measured in nanometers), and the standard limits of the integral areLe,Ω,λ in [380,780]}.
The values of X, Y, and Z are bounded if the radiance spectrum Le,Ω,λ is bounded.
Reflective and Transmissive Cases
The reflective and transmissive cases are very similar to the emissive case, with a few differences. The spectral radiance Le,Ω,λ is replaced by the spectral reflectance (or transmittance) S(λ) of the object being measured, multiplied by the spectral power distribution of the illuminant I(λ).


where

K is a scaling factor (usually 1 or 100), and is the wavelength of the equivalent monochromatic light (measured in nanometers), and the standard limits of the integral are..

![{\displaystyle \lambda \in [380,780]}](https://wikimedia.org/api/rest_v1/media/math/render/svg/4a2085e55423178ed3ce092367c2038d1af45d83)
CIE xy chromaticity diagram and the CIE xyY color space
Since the human eye has three types of color sensors that respond to different ranges of wavelengths, a full plot of all visible colors is a three-dimensional figure. However, the concept of color can be divided into two parts: brightness and chromaticity. For example, the color white is a bright color, while the color grey is considered to be a less bright version of that same white. In other words, the chromaticity of white and grey are the same while their brightness differs.
The CIE XYZ color space was deliberately designed so that the Y parameter is a measure of the luminance of a color. The chromaticity of a color is then specified by the two derived parameters x and y, two of the three normalized values being functions of all three tristimulus values X, Y, and Z:


The derived color space specified by x, y, and Y is known as the CIE xyY color space and is widely used to specify colors in practice.

The X and Z tristimulus values can be calculated back from the chromaticity values x and y and the Y tristimulus value:

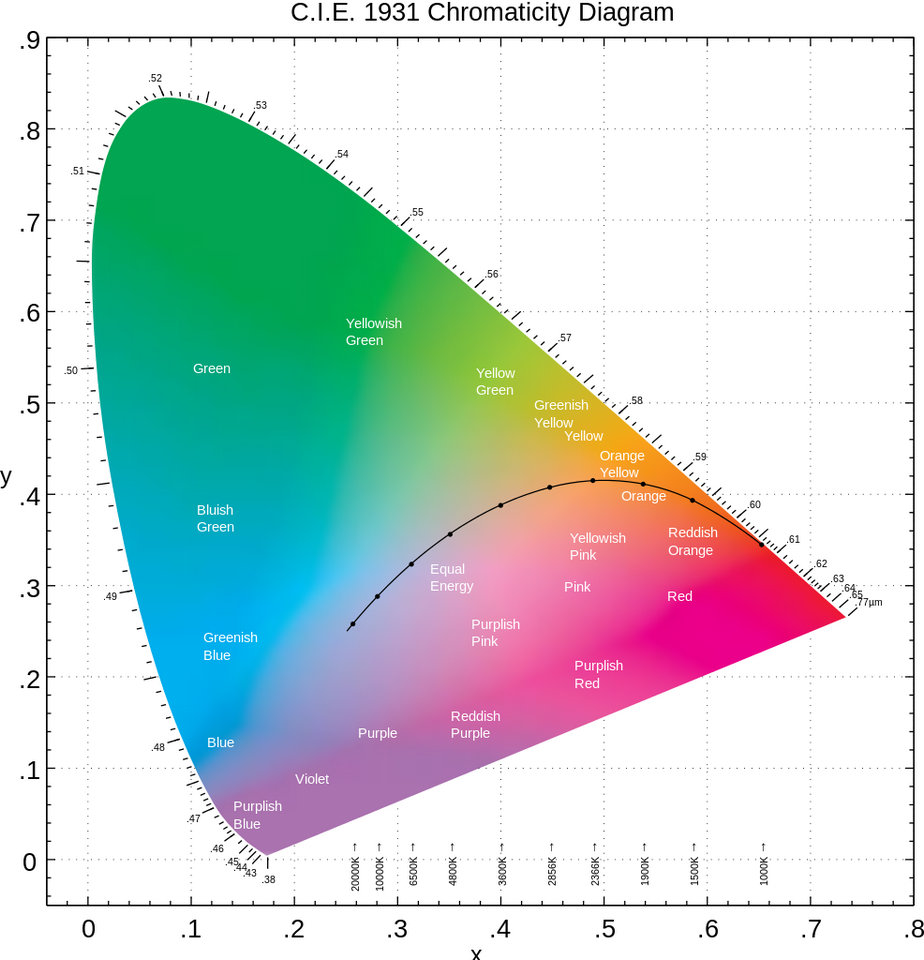
The figure on the right shows the related chromaticity diagram. The outer curved boundary is the spectral locus, with wavelengths shown in nanometers. Note that the chromaticity diagram is a tool to specify how the human eye will experience light with a given spectrum. It cannot specify colors of objects (or printing inks), since the chromaticity observed while looking at an object depends on the light source as well.

Mathematically the colors of the chromaticity diagram occupy a region of the real projective plane.
The chromaticity diagram illustrates a number of interesting properties of the CIE XYZ color space:
The diagram represents all of the chromaticities visible to the average person. These are shown in color and this region is called the gamut of human vision. The gamut of all visible chromaticities on the CIE plot is the tongue-shaped or horseshoe-shaped figure shown in color. The curved edge of the gamut is called the spectral locus and corresponds to monochromatic light (each point representing a pure hue of a single wavelength), with wavelengths listed in nanometers. The straight edge on the lower part of the gamut is called the line of purples. These colors, although they are on the border of the gamut, have no counterpart in monochromatic light. Less saturated colors appear in the interior of the figure with white at the center.
It is seen that all visible chromaticities correspond to non-negative values of x, y, and z (and therefore to non-negative values of X, Y, and Z).
If one chooses any two points of color on the chromaticity diagram, then all the colors that lie in a straight line between the two points can be formed by mixing these two colors. It follows that the gamut of colors must be convex in shape. All colors that can be formed by mixing three sources are found inside the triangle formed by the source points on the chromaticity diagram (and so on for multiple sources).
An equal mixture of two equally bright colors will not generally lie on the midpoint of that line segment. In more general terms, a distance on the CIE xy chromaticity diagram does not correspond to the degree of difference between two colors. In the early 1940s, David MacAdam studied the nature of visual sensitivity to color differences, and summarized his results in the concept of a MacAdam ellipse. Based on the work of MacAdam, the CIE 1960, CIE 1964, and CIE 1976 color spaces were developed, with the goal of achieving perceptual uniformity (have an equal distance in the color space correspond to equal differences in color). Although they were a distinct improvement over the CIE 1931 system, they were not completely free of distortion.
It can be seen that, given three real sources, these sources cannot cover the gamut of human vision. Geometrically stated, there are no three points within the gamut that form a triangle that includes the entire gamut; or more simply, the gamut of human vision is not a triangle.
Light with a flat power spectrum in terms of wavelength (equal power in every 1 nm interval) corresponds to the point (x, y) = (1/3, 1/3).
Mixing colors specified with the CIE xy chromaticity diagram
When two or more colors are additively mixed, the x and y chromaticity coordinates of the resulting color (xmix,ymix) may be calculated from the chromaticities of the mixture components (x1,y1; x2,y2; …; xn,yn) and their corresponding luminances (L1, L2, …, Ln) with the following formulas:
These formulas can be derived from the previously presented definitions of x and y chromaticity coordinates by taking advantage of the fact that the tristimulus values X, Y, and Z of the individual mixture components are directly additive. In place of the luminance values (L1, L2, etc.) one can alternatively use any other photometric quantity that is directly proportional to the tristimulus value Y (naturally meaning that Y itself can also be used as well).

As already mentioned, when two colors are mixed, the resulting color xmix,ymix will lie on the straight line segment that connects these colors on the CIE xy chromaticity diagram. To calculate the mixing ratio of the component colors x1,y1 and x2,y2 that results in a certain xmix,ymix on this line segment, one can use the formula
where L1 is the luminance of color x1,y1 and L2 the luminance of color x2,y2. Note that because ymix is unambiguously determined by xmix and vice versa, knowing just another of them is enough for calculating the mixing ratio. Also note that the mixing ratio L1/L2 may – in accordance with the remarks concerning the formulas for xmix and ymix – well be expressed in terms of other photometric quantities than luminance.

Definition of the CIE XYZ color space
CIE RGB color space
The CIE RGB color space is one of many RGB color spaces, distinguished by a particular set of monochromatic (single-wavelength) primary colors.
In the 1920s, W. David Wright and John Guild independently conducted a series of experiments on human sight which laid the foundation for the specification of the CIE XYZ color space. Wright carried out trichromatic color matching experiments with ten observers. Guild actually conducted his experiments with seven observers.
The experiments were conducted by using a circular split screen (a bipartite field) 2 degrees in diameter, which is the angular size of the human fovea. On one side of the field a test color was projected and on the other side, an observer-adjustable color was projected. The adjustable color was a mixture of three primary colors, each with fixed chromaticity, but with adjustable brightness.
The observer would alter the brightness of each of the three primary beams until a match to the test color was observed. Not all test colors could be matched using this technique. When this was the case, a variable amount of one of the primaries could be added to the test color, and a match with the remaining two primaries was carried out with the variable color spot. For these cases, the amount of the primary added to the test color was considered to be a negative value. In this way, the entire range of human color perception could be covered. When the test colors were monochromatic, a plot could be made of the amount of each primary used as a function of the wavelength of the test color. These three functions are called the color matching functions for that particular experiment.
Although Wright and Guild’s experiments were carried out using various primaries at various intensities, and although they used a number of different observers, all of their results were summarized by the standardized CIE RGB color matching functions , , and , obtained using three monochromatic primaries at standardized wavelengths of 700 nm (red), 546.1 nm (green) and 435.8 nm (blue). The color matching functions are the amounts of primaries needed to match the monochromatic test primary. These functions are shown in the plot on the right (CIE 1931). Note that and are zero at 435.8 nm, and are zero at 546.1 nm and and are zero at 700 nm, since in these cases the test color is one of the primaries. The primaries with wavelengths 546.1 nm and 435.8 nm were chosen because they are easily reproducible monochromatic lines of a mercury vapor discharge. The 700 nm wavelength, which in 1931 was difficult to reproduce as a monochromatic beam, was chosen because the eye’s perception of color is rather unchanging at this wavelength, and therefore small errors in wavelength of this primary would have little effect on the results.


The color matching functions and primaries were settled upon by a CIE special commission after considerable deliberation. The cut-offs at the short- and long-wavelength side of the diagram are chosen somewhat arbitrarily; the human eye can actually see light with wavelengths up to about 810 nm, but with a sensitivity that is many thousand times lower than for green light. These color matching functions define what is known as the “1931 CIE standard observer”. Note that rather than specify the brightness of each primary, the curves are normalized to have constant area beneath them. This area is fixed to a particular value by specifying that
The resulting normalized color matching functions are then scaled in the r:g:b ratio of 1:4.5907:0.0601 for source luminance and 72.0962:1.3791:1 for source radiance to reproduce the true color matching functions. By proposing that the primaries be standardized, the CIE established an international system of objective color notation.

Given these scaled color matching functions, the RGB tristimulus values for a color with a spectral power distribution would then be given by:
 would then be given by:


These are all inner products and can be thought of as a projection of an infinite-dimensional spectrum to a three-dimensional color.

Grassmann’s law
One might ask: “Why is it possible that Wright and Guild’s results can be summarized using different primaries and different intensities from those actually used?” One might also ask: “What about the case when the test colors being matched are not monochromatic?” The answer to both of these questions lies in the (near) linearity of human color perception. This linearity is expressed in Grassmann’s law.
The CIE RGB space can be used to define chromaticity in the usual way: The chromaticity coordinates are r and g where:


Source From Wikipedia